The UK’s Vehicle
Crime Hotspots
Where, when, and how are you most likely to be a victim of vehicle crime?
Where, when, and how are you most likely to be a victim of vehicle crime?
While there are many types of vehicle crime, according to police recorded crime data from the Home Office, there were over 348,000 vehicle theft offences in England and Wales last year. More than a quarter of these offences (29%) were classed as theft or unauthorised taking of a motor vehicle, which means that having your vehicle stolen is a very real possibility.
If you're lucky enough not to get your vehicle stolen, crime statistics show that you could still be a victim of vehicle crime in the form of external damage or having your vehicle broken into. More than half of vehicle theft offences last year (56%) were of theft from a vehicle.
With vehicle crime still prominent across the country, we wanted to find out where drivers should take extra precautions, what thieves are looking for, and when thieves are striking.
Armed with police, FOI and government data, we’ve been able to map the UK’s vehicle crime hotspots, look at changing behaviours of thieves as they adapt to new innovations, and find out what type of vehicles criminals are looking for. Our expert team has also offered up some top tips to help keep you and your vehicle safe.
Unsurprisingly, London recorded the most vehicle crimes in 2021. More than 100,000 crimes (which includes vehicle theft and vandalism) were reported by the Metropolitan Police Service between January and December 2021.
West Midlands was in second spot, albeit with nearly 70% fewer incidents. Just over 30,000 crimes were reported by West Midlands police, a huge decrease from the capital. However, it’s West Yorkshire that rounds off the top three with just over 14,000 vehicle crimes reported to their local police last year.


You’d be forgiven for thinking that the cover of darkness offers the perfect opportunity to steal a car, but it seems that thieves are becoming more brazen, swapping night and evening robberies in favour of daylight robbery. We’ve looked at data up until the Covid-19 pandemic to get an overview of vehicle crime in the UK, before the national lockdowns forced people to stay at home.
The research found thefts in the morning or afternoon increased 113% in the 10 years to March 2020. Thefts at night or in the evening, however, decreased 21% during the same timeframe. In a similar trend, vehicle thefts taking place during the week became more common than a decade ago. Weekday vehicle theft increased more than 35% in the 10 years to March 2020. Weekend thefts, on the other hand, decreased 44% during the same timeframe.
Data for each year is from April to March.
During the week is from Monday 6am to Friday 6pm. Weekend is from Friday 6pm to Monday 6am.
Morning/Afternoon is from 6am to 6pm. Evening/Night is from 6pm to 6am.
Believe it or not, nearly half (44%) of vehicle thefts that took place between April 2019 and March 2020 did so because the vehicle had been left unlocked - an increase of 91.3% on the same timeframe a decade earlier.
Although locking your car is our number one tip for keeping your vehicle safe, it doesn’t always mean you can guarantee its security. Thieves are becoming more tech savvy, and as such, keyless theft is on the up. Before April 2018, this wasn’t recorded as a method of entry. However, in the year leading into March 2020, it was the third most common technique for vehicle theft, behind the door not being locked and the window being broken.
Data for each year is from April to March.
Figures may not sum to 100 as respondents can provide up to two options.

While vehicle crime continues to take place all across the country, research suggests fewer vehicles are being returned to their owner. 19% fewer vehicles were returned to their owner in the year leading to March 2020, compared to the same timeframe 10 years before. The number not returned to their owner is the highest in a decade.
Despite fewer vehicles being returned, more vehicles are recovered with no damage. Between April 2009 and March 2010, just 15% of vehicles were recovered with no damage and 85% were marked as damaged. Since then, there has been a 19% decline in write-offs and for April 2019 – March 2020, more than half of the vehicles were recovered with no damage (52%), while 48% were damaged.
Data for each year is from April to March.
It’s not just the theft of your vehicle you have to worry about; it’s what’s inside that counts, too. The average cost of items stolen from a vehicle has jumped up by more than 96% in the 10 years leading to March 2020. The most common theft is general valuables, labelled as jewellery, handbags/briefcases/shopping bags, purses/wallets, cash, chequebooks, credit cards, clothes and other documents. Up nearly 10% year on year, these smaller items seem to catch thieves’ eyes. Likewise, thefts of food, toiletries and cigarettes have increased year on year.
The number of thefts involving tools also increased significantly. Over the 10 years to April 2019-March 2020, instances of tool theft shot up 150%. Yet electrical equipment theft, such as sat navs, televisions, videos, MP3 players, DVD players and computer equipment, declined.
Data for each year is from April to March.
* ‘Valuables’ includes jewellery, handbag/briefcase/shopping bag, purses/wallets, cash, cheque books, credit cards, clothes and documents.
** ‘Electrical equipment’ includes satellite navigation systems, televisions, videos, MP3 players, DVD players and computer equipment.)

Being a victim of crime can have long-term effects and car crime is no exception. Almost one in five victims of car crime reported having difficulty sleeping, crying and having panic attacks or feeling anxious as a result of the crime.
The number of victims who were shocked increased significantly (54%) between March 2009 and April 2020. This compared to a decline in the number of people feeling angry, which decreased 23% during the same time period.


Data for each year is from April to March
Figures here are based on incidents in which the victim reported that they were emotionally affected by the incident.
Figures may not sum to 100 as more than one response possible.
Unsurprisingly, as the most popular vehicle on our roads, cars are the most stolen vehicle in general. However, van owners should be sure to secure their property in West Yorkshire. In 2020, nearly a quarter of all vehicle thefts in this area were vans (23%). Similarly, nearly one in five vehicle thefts in Derbyshire were also vans.
Bikers should take extra care in Avon and Somerset, Devon and Cornwall and Derbyshire, as more than a quarter of vehicle crimes in these areas involved motorbikes.
While many Brits are continuing to holiday in the UK, you want to know your vehicle is safe while on your travels. The safest staycation hotspots for vehicles are Dyfed-Powys, Cumbria and North Wales. Those heading to Essex or South Yorkshire may want to take extra precautions, however, as they’re both in the top 10 when it comes to vehicle crime over the past year.
You can never guarantee your vehicle will be safe, but there are precautions you can take to deter thieves. Here are a few of our top tips:

It sounds obvious, but if the research has told us anything, it’s to ensure that you lock your vehicle. If you’ve got remote locking it can sometimes be easy to miss whether the vehicle has actually locked or not, so always double check before you walk away.
Also never leave your engine running while you’re not around, such as when defrosting a vehicle in winter or taking shopping into your house.

If you have a garage, that’s the safest place for your vehicle. Failing that, a driveway with a gate will also act as a deterrent. If you don’t have a driveway, always choose a well-lit and open road close by. If you’re out and about, try and park in a Park Mark standard carpark - these car parks must have passed a police risk assessment. If you park on the road, it’s advisable to turn your wheels into the kerb as it makes vehicles much harder to steal.
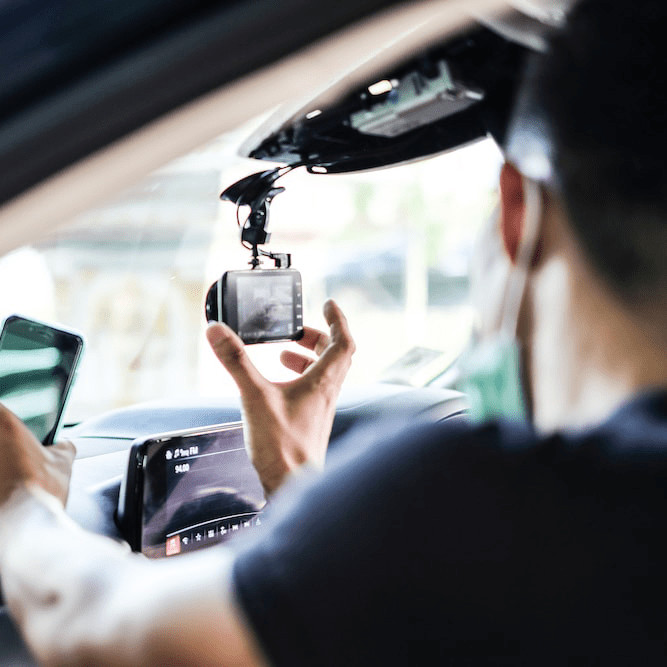
Dash cams aren’t just for accidents. In fact, a dash cam with intelligent parking mode will switch itself on and start recording when it detects any movement, capturing criminals in the act, and as such, can deter them from breaking in or stealing your vehicle.
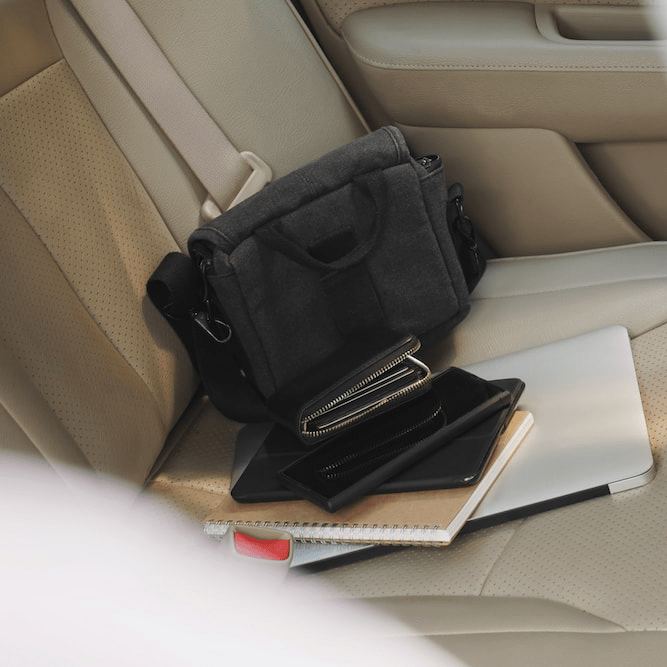
Again, another obvious tip is to keep your valuables hidden – or better still not in your vehicle at all. We know that the most common stolen items are small and easy to grab, such as handbags, wallets, credit cards and shopping bags, so keep them out of sight.
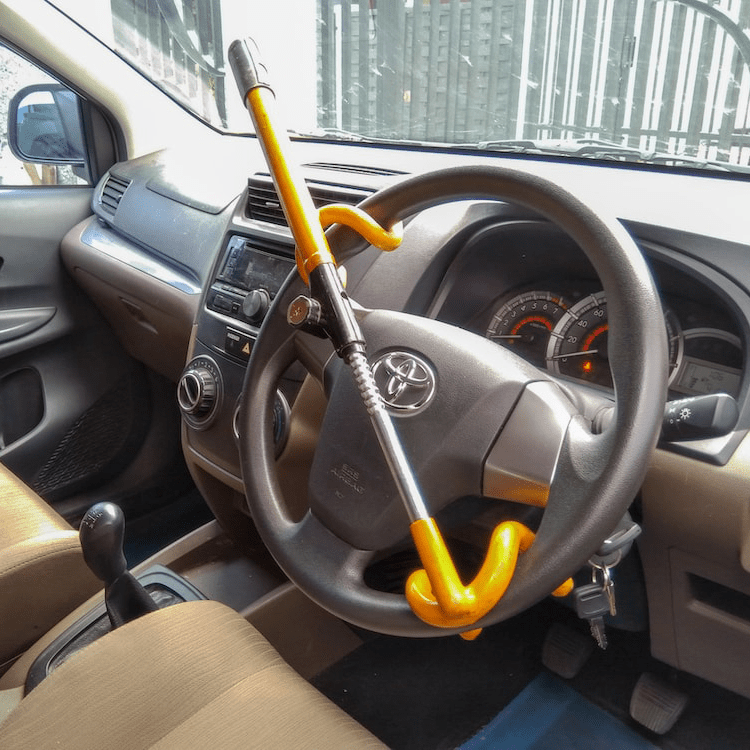
Keyless theft is where thieves use digital devices to clone your car key fob’s signal and relay it directly to your vehicle. This opens the doors and allows them to drive away.
We know that keyless theft is on the rise. And although there’s not much you can do to stop interceptions, you can halt them in their tracks by getting a steering wheel lock and using it whenever and wherever you park your vehicle.
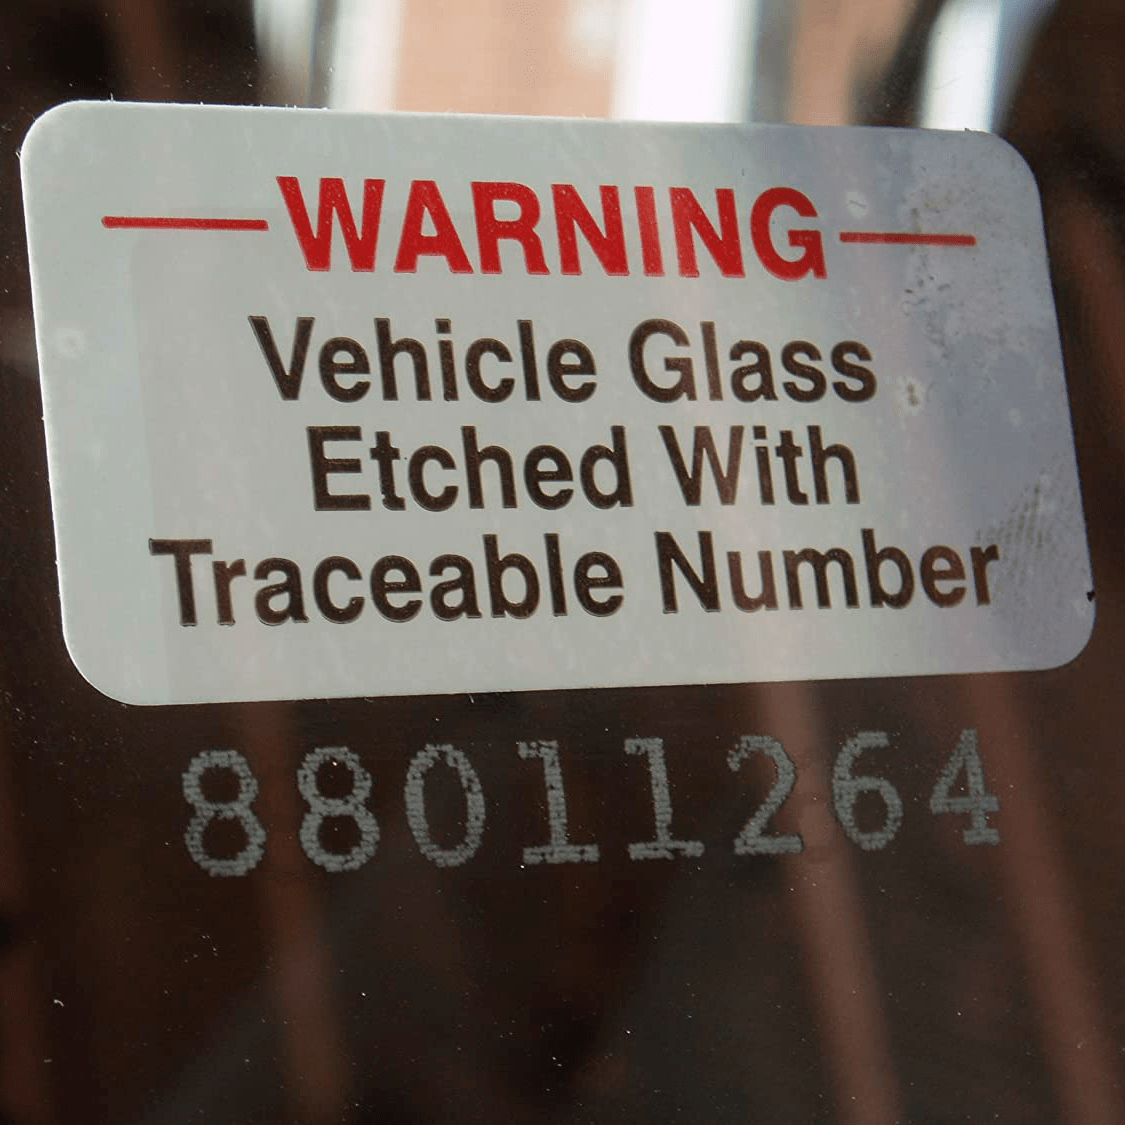
Window etching is the method of clearly and permanently putting a unique code and the logo of the International Security Register (the ISR) onto your car windows, in order to protect against car cloning – and make it easier to recover. The process is fast and relatively cheap so is definitely worth investing in if you can.
At Northgate we offer flexible van hire across a whole range of vans from the VW Transporter to the Ford Transit 350. We operate all over the UK, so if you’re looking for large, medium or small van hire, or even lwb van hire, search our branch finder for van hire near you.
Data on the frequency of thefts by vehicle type came from FOI requests made to every police force in the country (2020). Not all police forces replied (either at all or within the deadline), but the forces included in this dataset are: West Yorkshire, Derbyshire, Durham, West Midlands, Leicestershire, Northamptonshire, Surrey, Merseyside, Nottinghamshire, Metropolitan Police, Kent, North Wales, Avon and Somerset, Cheshire, Lancashire, Staffordshire, Gloucestershire, Dyfed-Powys, Humberside, Cambridgeshire, Bedfordshire.
Data on vehicle crimes by location (2021) was scraped from: https://data.police.uk.
All other stats have been taken from the Crime Survey for England and Wales by the Office for National Statistics. Due to the UK national lockdowns, the method of this data had changed and so some datasets were not provided in the most recent releases. Time of theft, method of entry, vehicle return rate, stolen items and the effects of car crime were taken from previous releases of the data.
To calculate the percentage of thefts by vehicle type in each area we referred to the crime figures for ‘cars’ where they were classified as such in the data (forces include Avon and Somerset, Cheshire, Cumbria, Devon and Cornwall, Durham, Dyfed-Powys, Humberside, Leicestershire, Merseyside, North Wales, Northamptonshire, Nottinghamshire, Staffordshire, Surrey, West Midlands, West Yorkshire, Derbyshire, Gloucestershire. Where police forced instead listed several types of car, we added up the values for categories including saloon, 4x4, convertible, hatchback, etc.
Crimes by vehicle type are not always recorded by police. For some forces, ‘not recorded’ was the most used categorisation. There is no way to know the % of cars, vans, motorcycles, included in those particular figures.


This work is licensed under a Creative Commons Attribution-ShareAlike 4.0 International License.